
Introduction: Why Micro‑Changes Matter
The stock market is often perceived as a sea of chaos—prices ticking up and down by fractions of a cent, thousands of trades occurring every second, and a constant flood of information. To most retail investors, these minute movements appear random, like background noise. But to the trained eye and data-driven systems, these tiny fluctuations—known as micro-changes—hold a wealth of hidden patterns.
Modern financial markets are shaped not only by large economic forces but also by algorithmic trades, market microstructure, and complex behavioral signals embedded within the daily ebb and flow of prices. Every microsecond, sophisticated strategies battle over milliseconds, seeking to gain edge in execution, prediction, and profitability.
In this post, we’ll dive deep into the microstructure of markets, explore how to detect patterns in daily price micro-movements, and examine how they can be used for both academic research and real-world trading. We’ll look at the tools, data sampling techniques, notable patterns, and advanced strategies that help decode what’s often seen as market “noise.”

1. Understanding Market Microstructure
Market microstructure refers to the mechanics of how trades occur in financial markets. Unlike macroeconomic analysis, which examines broader economic indicators, microstructure focuses on the how: how orders are placed, matched, and executed in real-time.
Key Elements of Microstructure
- Order Types: Limit orders, market orders, stop-loss, fill-or-kill—each comes with different intent and consequences.
- Bid-Ask Spread: The difference between what buyers are willing to pay (bid) and sellers want to receive (ask). It fluctuates throughout the day, often tightening in liquid times and widening in volatility.
- Order Flow: The sequence of buy/sell orders placed over time reveals collective sentiment shifts and short-term pressure.
High-Frequency Data and Latency Arbitrage
High-frequency trading (HFT) firms use millisecond-level data to exploit tiny inefficiencies. These strategies rely heavily on pattern recognition, liquidity detection, and latency optimization. While inaccessible to most retail traders, the principles behind them can inspire simplified models to detect and react to recurring intraday behavior.
Liquidity and Market Depth
Understanding liquidity—how easily assets can be bought or sold—reveals much about micro-changes. Thin liquidity often leads to sharp price spikes. By analyzing Level II data (the order book), we can observe real-time supply and demand pressures shaping price action at the smallest intervals.

2. Data Sources and Sampling Techniques
Finding reliable patterns in micro-changes depends heavily on how data is gathered and sampled. A common pitfall is using inappropriate time frames or sampling methods that obscure useful information.
Fixed-Time Sampling
This method captures data at regular intervals—every second, minute, or hour. It’s simple and consistent but can miss fast-moving dynamics during volatile moments or over-sample during quiet periods.
Event-Based Sampling
Instead of time, this technique triggers data collection based on events—like price changes over a threshold, volume spikes, or bid/ask shifts. This method often reveals clearer patterns as it adapts to market activity levels.
Directional-Change Intrinsic Time is a powerful variant. Instead of recording price at constant intervals, it records every time the price moves a set percentage in one direction. This adaptive method helps identify turning points and compression phases far better than fixed intervals.

3. Common Intraday Patterns
The financial markets exhibit recurring intraday patterns influenced by human behavior, institutional activity, and global news cycles. Let’s explore a few that frequently emerge in microstructure data.
1. Opening and Closing Volatility
The first and last 30 minutes of the trading day see heightened activity. At the open, overnight news and pre-market orders flood the market, causing price dislocations. Toward the close, institutions rebalance portfolios and fulfill end-of-day mandates, creating volume surges and abrupt price movements.
2. Lunchtime Lulls
Between 11:30 AM and 1:30 PM ET, trading activity dips—especially in U.S. markets. This lull can result in narrower ranges and lower volatility, often followed by a renewed trend or reversal after lunch.
3. Reversal Zones at Round Hours
Many stocks exhibit minor reversals around the top and bottom of each hour—possibly driven by algorithmic rebalancing, portfolio hedging, or pre-programmed trade bursts.
4. Candlestick Clusters and Traps
Repeated micro-candlestick patterns—such as doji clusters, engulfing mini-bars, or hikkake formations—can signal accumulation or distribution. These small formations often precede sharp directional moves once trapped liquidity is triggered.
4. Advanced Pattern Recognition
While simple time-based charts may reveal basic patterns, more sophisticated tools uncover deeper layers.
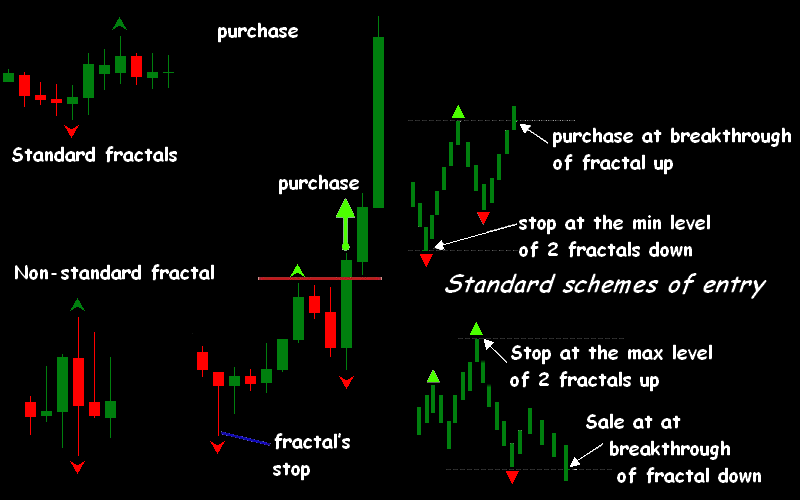
Fractals and Self-Similarity
Markets exhibit fractal behavior: small price moves mirror larger moves in shape and behavior. This fractality is the backbone of Elliott Wave Theory and Mandelbrot’s research. Micro-patterns like small ABC corrections or mini head-and-shoulders formations replicate broader technical patterns at a condensed scale.
Machine Learning & Clustering
With access to tick-level data, ML models can cluster similar market behaviors, revealing non-obvious regimes:
- K-means or DBSCAN clustering can segment days into “types”—trend, range, volatile, mean-reverting—based on intraday structure.
- LSTM and transformers can predict short-term direction based on recent order flow and micro-patterns.
Quantum Pattern Detection
Though still in its infancy, quantum computing offers new promise in detecting patterns within microsecond-level financial data, leveraging quantum annealing for portfolio optimization and signal recognition.
5. Micro-Patterns That Precede Price Jumps
Identifying the “fingerprint” of an impending breakout or flash crash is the holy grail of short-term trading. While no signal is perfect, some patterns have historical reliability.
Pre-Jump Order Book Behavior
Just before a price breakout, the following may be observed:
- Order Book Imbalance: Sudden leaning of liquidity to one side (e.g., massive bid wall with few asks).
- Iceberg Orders: Hidden orders that replenish consistently at a key price, signaling institutional accumulation or distribution.
Volume Surge Without Price Movement
Known as “quiet accumulation,” a burst of volume without accompanying price change often signals absorption—where smart money is building positions before a sharp move.
Latency Arbitrage Shadow
In fragmented markets, when one exchange moves milliseconds before another, HFTs exploit the lag. These shifts often precede retail-visible moves and can act as early warning signs.
6. Trading Strategies & Practical Applications
While microstructure analysis is highly complex, even simplified strategies can benefit from it. Let’s look at practical takeaways.
Mean-Reversion Micro Scalping
Stocks often revert to mean after short bursts. By identifying liquidity gaps or overextended moves within a single candle or two, traders can fade the move expecting a reversion within minutes.
Trend Continuation via Microstructure
During news-driven moves, traders can ride momentum by watching for:
- Continuous order flow in one direction
- Shrinking counter liquidity
- Low slippage execution
Execution Optimization
Institutional players optimize order size and timing using market microstructure insights to reduce slippage. Tools like VWAP (Volume-Weighted Average Price) and TWAP (Time-Weighted Average Price) split large trades into smaller slices throughout the day.
Avoiding Hidden Risks
Poor understanding of microstructure can lead to:
- Slippage from illiquid trades
- Getting trapped in fake breakouts (stop-hunting)
- Latency lag in fast-moving markets

7. Case Studies & Real-World Examples
The 2010 Flash Crash
On May 6, 2010, the Dow Jones plunged 1,000 points in minutes, before rebounding. HFTs withdrew liquidity en masse, creating a vacuum. Market microstructure data showed rapid order cancellations, spoofing behavior, and latency loops that created a perfect storm.
GameStop & Retail Frenzy (2021)
During the Reddit-fueled GME squeeze, order books were frequently cleared of ask-side liquidity in seconds, with limit orders shifting unpredictably. Despite chaotic charts, consistent micro-patterns in volume, bid-ask pressure, and volatility predicted upcoming price surges.
Crypto Intraday Behavior
Cryptocurrencies, being 24/7 and lightly regulated, are a playground for micro-pattern detection:
- Bitcoin often shows mini-pumps on Sundays
- Order spoofing is more common and visible
- Slippage and liquidity gaps around altcoins lead to frequent flash crashes
8. Conclusion & Future Outlook
In the world of finance, the smallest movements often tell the most profound stories. Hidden within daily stock market micro-changes are patterns, behaviors, and signals that, when properly interpreted, offer tremendous insight into market dynamics and potential opportunities.
For traders, understanding market microstructure can mean better entries, faster exits, and reduced slippage. For analysts, it provides a data-rich field to uncover systemic risk and behavioral biases. And for technologists, it’s a domain where AI, machine learning, and even quantum computing may redefine what’s possible.
As markets grow more complex and faster, mastering the micro may become more important than ever. Whether you’re an individual trader, institutional analyst, or curious observer—learning to see the invisible patterns shaping each tick might just be your next competitive edge.

📢 Ready to go deeper?
At Daily Reports, we’re committed to unpacking hidden layers of daily data. Stay tuned for upcoming posts on “Microstructure Patterns in Options Flow”, “Tracking Dark Pool Liquidity Movements”, and more!